Perennial Peanut ‘Cowboy’ Shows Potential for Agrivoltaic Integration
by Melanie Frick
Odum School of Ecology
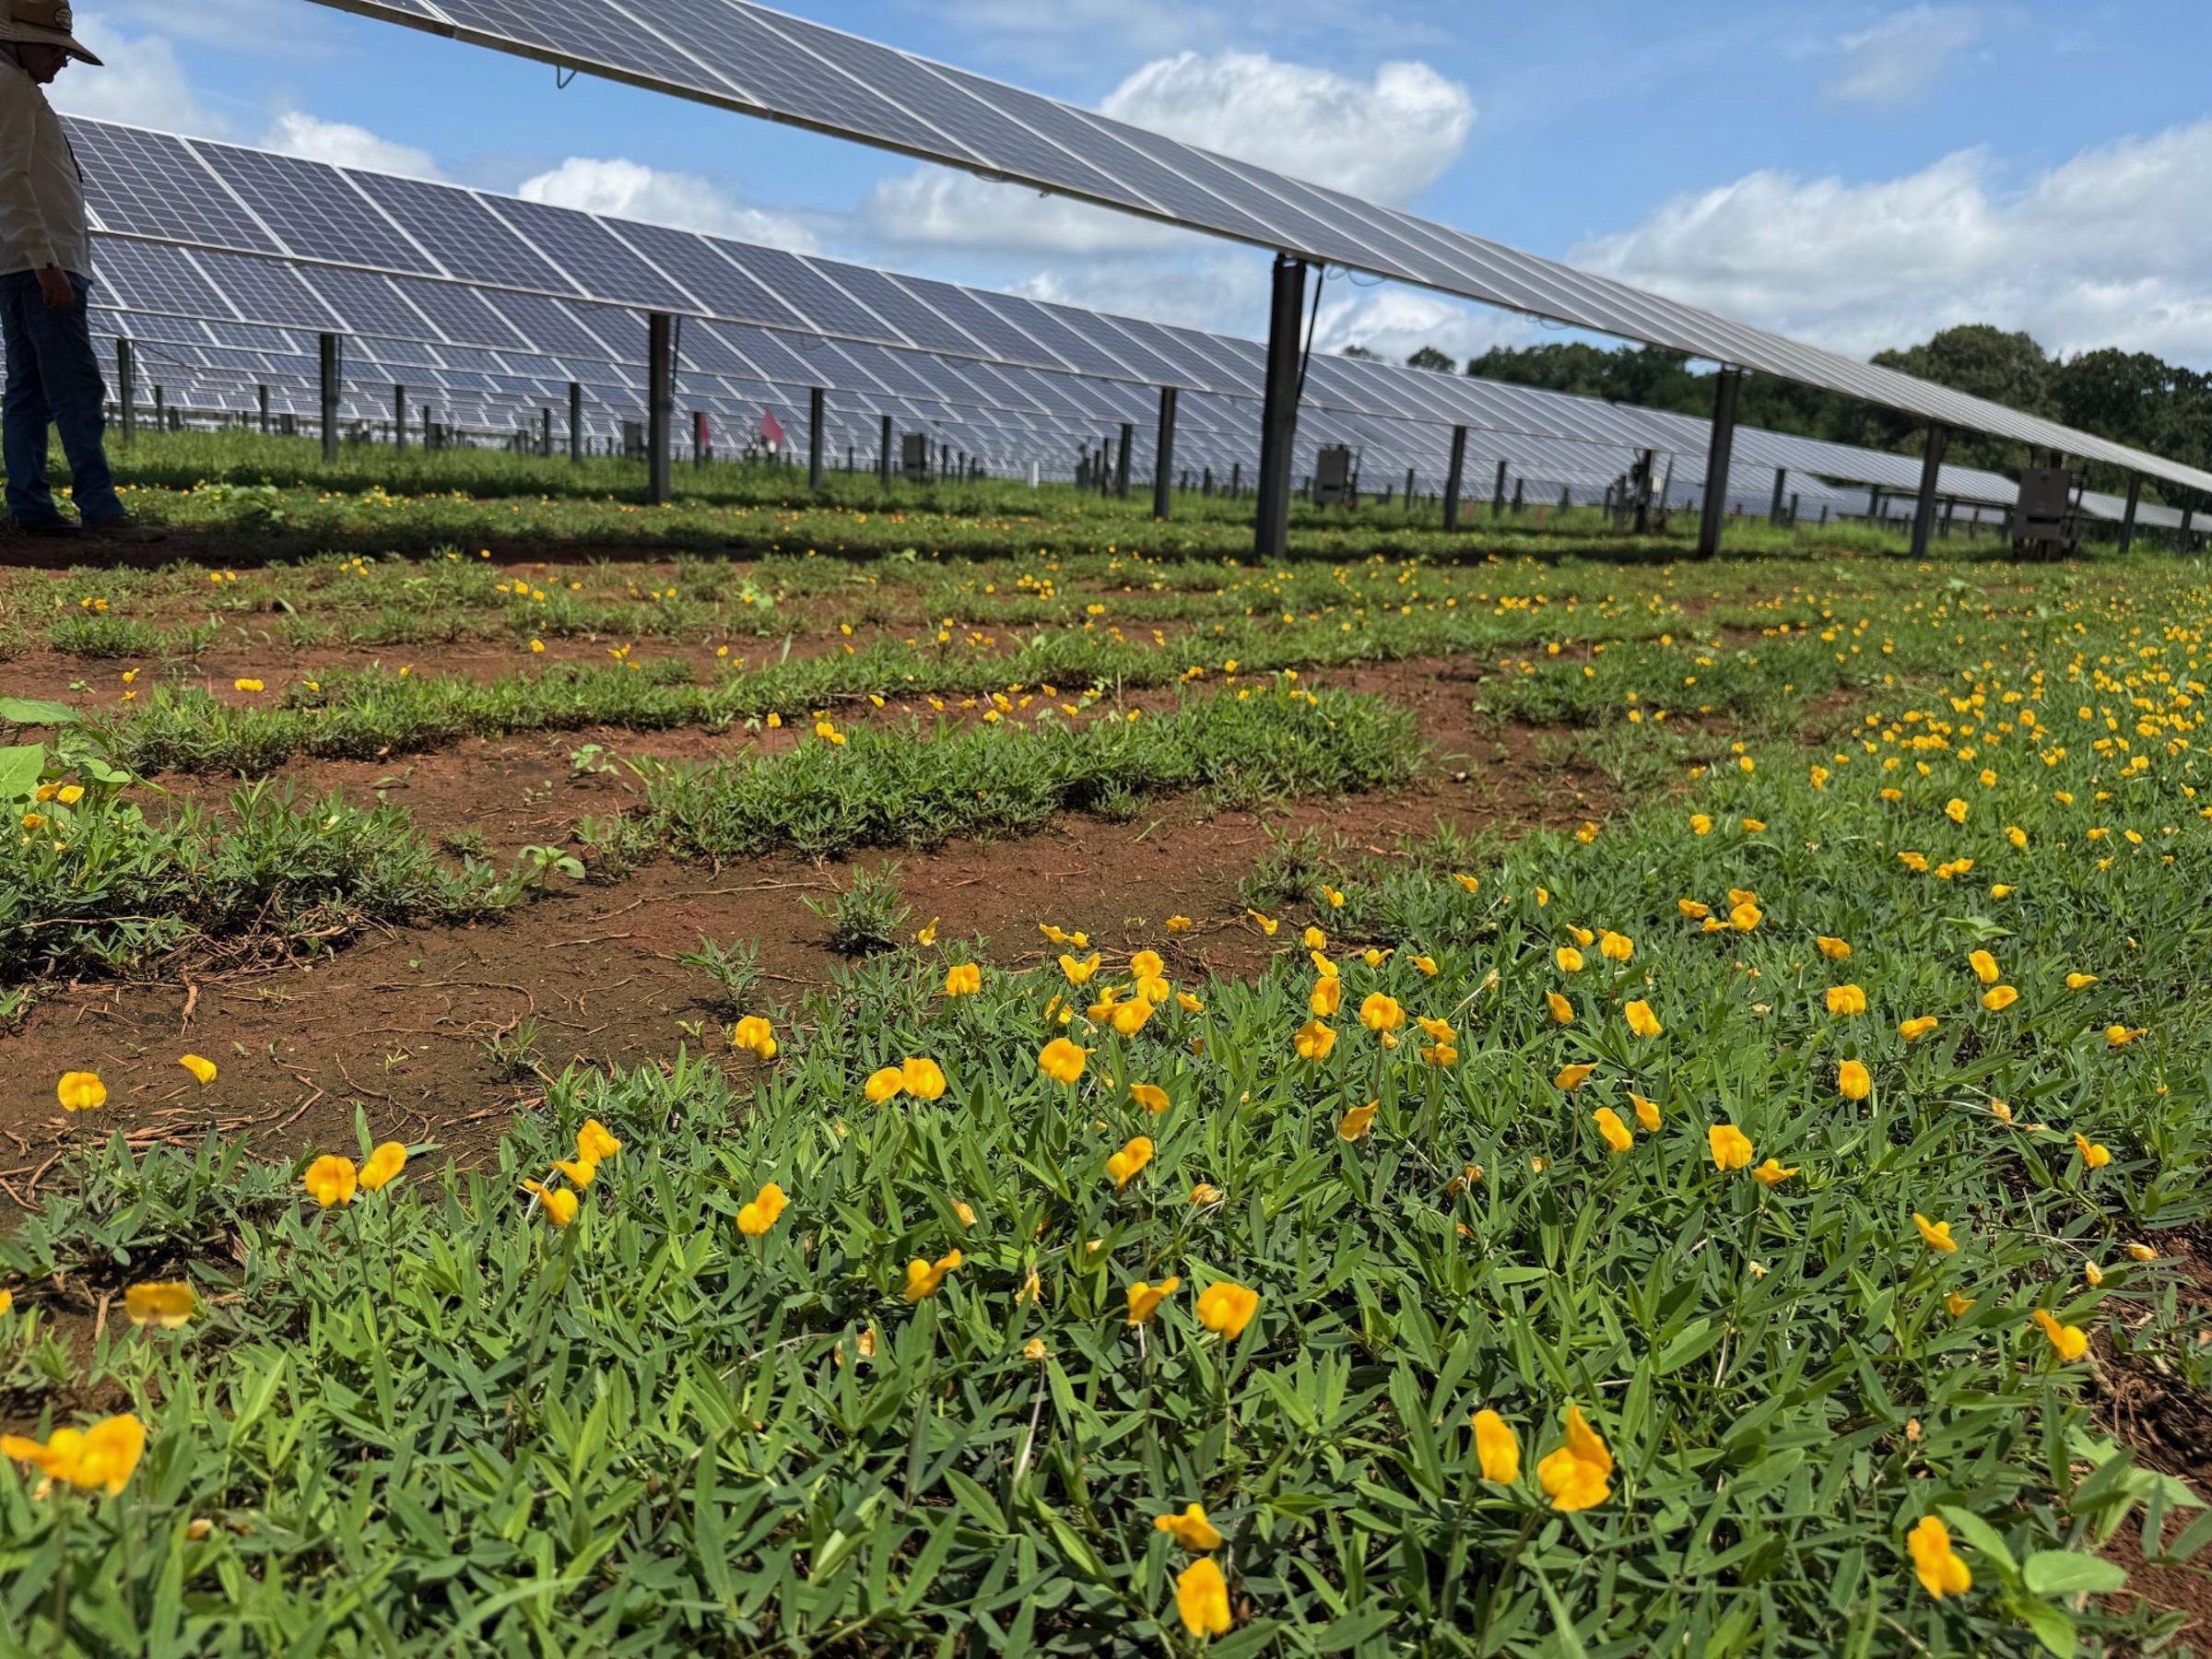
Georgia is ranked 7th in the nation for solar installations and is driving interest in agrivoltaics–the co-location of agriculture, such as crops and livestock, with solar energy production. Rhizoma perennial peanut (RP or Arachis glabrata Benth.) is a nitrogen-fixing legume with traits ideal for grazing livestock and ecosystem service support. RP performs well in shaded conditions and is drought tolerant once established, which makes it an ideal candidate as a groundcover in photovoltaic installations. However, RP’s performance under panel microclimates, created by reduced light radiation and variations in temperature and humidity, remains uncertain. My project aims to investigate photovoltaic microclimate impacts on the establishment of RP ‘Cowboy,’ a UGA-bred cultivar, at the Jimmy Carter Solar Pollinator Park in Plains, Georgia. I seek to answer two main questions: (1) how the microclimate variation within solar arrays impacts RP’s growth; and (2) whether solar panels can mitigate or reduce plant stress induced by freezing temperatures. I hypothesize that microclimate variation will positively impact plant performance, with the part-shade treatments having the highest growth and the RP underneath panels having the lowest temperature-induced plant stress. Data taken last fall of each microclimate’s canopy spread, percent damage due to cold temperatures, stomatal conductance, and chlorophyll inflorescence are presented in this study. Results partially support my hypothesis, with RP experiencing higher stress within full-sun microclimate treatments. My research incorporates novel crop use under solar conditions, focusing on plant developmental and adaptive dynamics, and evaluates whether integrating RP can enhance ecological productivity of agrivoltaic systems.
rhizoma perennial peanut, Arachis glabrata Benth., agrivoltaics, solar fields, ecology, rhizoma perennial peanut ‘Cowboy’
Introduction
Across the United States, the transition to renewable solar energy generation is increasing. Utility-scale solar installations are projected to take up to 10.3 million acres of land by 2050 to meet national demands. Although this is less than 1% of U.S. land area, rural agricultural land is projected to house 90% of these installations (Ardani et al., 2021). Currently, Georgia is ranked 7th in the nation for solar installations (Shaw et al., 2024). As of June 2025, Georgia has 5,274 megawatts (MW) of operational utility-scale solar generation, representing 21,098 to 36,921 acres of land (Carl Vinson Institute of Government, 2025). By 2030, this development is expected to expand between 16,507 and 28,887 acres. The University of Georgia’s Warnell School of Forestry and Natural Resources reported that of current operational solar facilities, 55% were built on forest land, and 43% on farmland (Maerz & Hepinstall-Cymerman, 2025).
This growth is supported by the Inflation Reduction Act, bringing new solar panel manufacturing projects to Georgia (Environmental Protection Agency, 2025). Across the state, farmers are growing anxious about climate unpredictability and land loss due to the solar industry. There is a fear, particularly among young farmers, that solar industries would take their land, making it nearly impossible to return land to viable agricultural production once a solar landscape is established (Schnur et al., 2024; Stock & Birkenholtz, 2019).
Agrivoltaics offers solutions for farmers and energy companies through the practice of co-locating agricultural production, such as crops and livestock grazing, and photovoltaics (PV), otherwise known as solar energy generation, on the same land (Macknick et al., 2022). Not only does this ease the land competition between energy companies and farmers, but studies have reported benefits such as reduced plant drought stress, higher crop production, and reduced panel heat stress (Barron-Gafford et al., 2019; Moon & Ku, 2023). There are a variety of land-use options under agrivoltaic operations. Agrivoltaic sites in Georgia include, but are not limited to, Silicon Ranch’s 68-megawatt Houston Solar Project, which employs sheep grazing (Silicon Ranch, 2023), as well as the Jimmy Carter Solar Array, a seven acre site in Plains, Georgia, where UGA is researching how perennial legumes, native wildflowers, and grasses perform under solar installations (Pennisi, 2021; Macknick et al., 2022).
It is common practice to seed large-scale solar installations with perennial non-native turfgrasses (such as bahia and bermuda) for water mitigation to reduce soil erosion and runoff and sustain the ground during dry periods without intensive maintenance (Mier-Valderrama et al., 2023; Ugiansky, 2020). In Georgia, stated required and recommended practices for siting and designing solar development are clearly stated. According to the Georgia Department of Natural Resources, a well-developed stormwater management plan is essential for protecting waters of the state, such as determining pre- and post- construction stormwater coefficients (GA DNR, 2024).
Although turfgrass is standard vegetation on solar sites, it does not provide optimal forage for grazers and has to be supplemented with legumes such as annual vetch, or clover. These require annual seeding, which not only increases inputs but can also lead to soil compaction over time. Perennial legumes hold potential as an alternative to annual legumes within agrivoltaic sites due to their superior qualities as a durable, low-input groundcover, high digestible fiber content and ability to fix over 100 lbs N/acre per season. Legumes supply nitrogen to the soil through biological nitrogen fixation and releasing nitrogen-rich root exudates (Lange et al., 2014) and can minimize the need for artificial fertilizers, which have the potential to leach excess nitrogen into groundwater (Owens & Bonta, 2004). Soil microbial communities are altered as a result of the increased nitrogen, further impacting the nitrogen cycling process (Zhou et al., 2017). Additionally, legumes offer agrivoltaic grazers a higher-protein diet (Santos et al., 2025).
Rhizoma perennial peanut (RP, Arachis glabrata Benth.) is a warm season perennial legume native to South America (Anderson et al., 2015), used mostly as a forage crop since the 1930s (Anderson et al., 2015). Due to RP’s ability to spread laterally by an extensive rhizome system, which accounts for 85% of RP’s biomass (Williams, 1994), it can spread into surrounding perennial grass communities to form a mixed pasture (Mullenix et al., 2014). Due to these rhizomes, RP is drought tolerant and pest and disease resistant once established (Baltensperger et al., 1986; Quesenberry et al., 2010). RP can be grown alongside perennial grasses to maintain productivity and lessen artificial fertilizer requirements (Jaramillo et al., 2018; Mullenix et al., 2014). Integrated plantings can increase the nutritive value for grazers and soil nitrogen content (Williams et al., 1991).
One study described that a 30% shade treatment had little effect on the time it took for RP to reach full canopy cover or the duration of full canopy cover, showcasing the potential for RP to perform equally in full sun or under shaded conditions (Anderson et al., 2015). These findings indicate that RP may have some resiliency under shaded conditions created by solar panels. However, most RP research centers around the cultivars ‘Florigraze’ and ‘Ecoturf.’
In 2015, Wayne Hanna, a University of Georgia turfgrass scientist, released rhizoma perennial peanut ‘Cowboy’ (Thompson, 2017). The Cowboy cultivar produces yellow flowers from May through September. If left unmowed, it can grow as high as 12 to 14 inches, tall enough to be cut for hay. Prior to its release, UGA researchers planted RP ‘Cowboy’ in a citrus grove in Turner County, Georgia. Due to Cowboy’s nitrogen-fixing properties, no additional fertilizer was needed, and it was highly drought tolerant once established (Thompson, 2017).
As a tropical perennial, RP has been grown in U.S. Department of Agriculture hardiness zones 8b and greater, encompassing Florida and the U.S. Southern Coastal Plain (Terrill et al., 1996). Preliminary data indicates that RP ‘Ecoturf’ can be successfully grown in more northern latitudes outside the current production areas (USDA Hardiness Zone 9a) and in finer-textured soils, with minimum inputs of water and fertilizer (Pitardi et al., 2025). However, no RP cultivar has been assessed under the microclimate variability that solar panels create.
Surrounding microclimates are altered by the physical shading of solar panels, which reduces soil heat absorption during the spring and summer and prevents heat loss during autumn and winter, with one study finding that solar panels decreased the mean annual net radiation to soil by 92.68% (Zheng et al., 2023). This same study demonstrated that relative humidity underneath solar panels was 2.03% higher throughout summer and spring. In order to optimize the groundcover beneath solar panels, it is critical to close the knowledge gap of how PV microclimate variability impacts plant establishment within a solar installation setting. Solar panels create gradients in light as well as temperature, resulting in mitigated temperature extremes underneath panels. As a cold-sensitive plant, it could be hypothesized that RP may be protected by solar panel microclimates, enabling plant survival during the winter, and allowing RP to be grown outside of its standard range.
This project focuses on assessing performance of RP ‘Cowboy’ grown under a solar array. The broad objective is to inform solar sites’ land managers whether this novel cultivar could integrate well as vegetation within an agrivoltaic setting. I seek to address the following questions: (1) how the microclimate variation within solar arrays impacts RP’s growth; and (2) whether solar panels mitigate or reduce plant stress induced by freezing temperatures. I hypothesize that microclimate variation will positively impact plant performance, with the part-shade treatments having the highest growth and the RP underneath panels having the lowest temperature-induced plant stress. My null hypothesis is that plant growth will remain constant across PV and non-PV treatments, as well as constant across all microclimates created by solar panels (part-shade, full-sun, full-shade).
Materials and Methods
Study Site, Experimental Layout, and Treatments
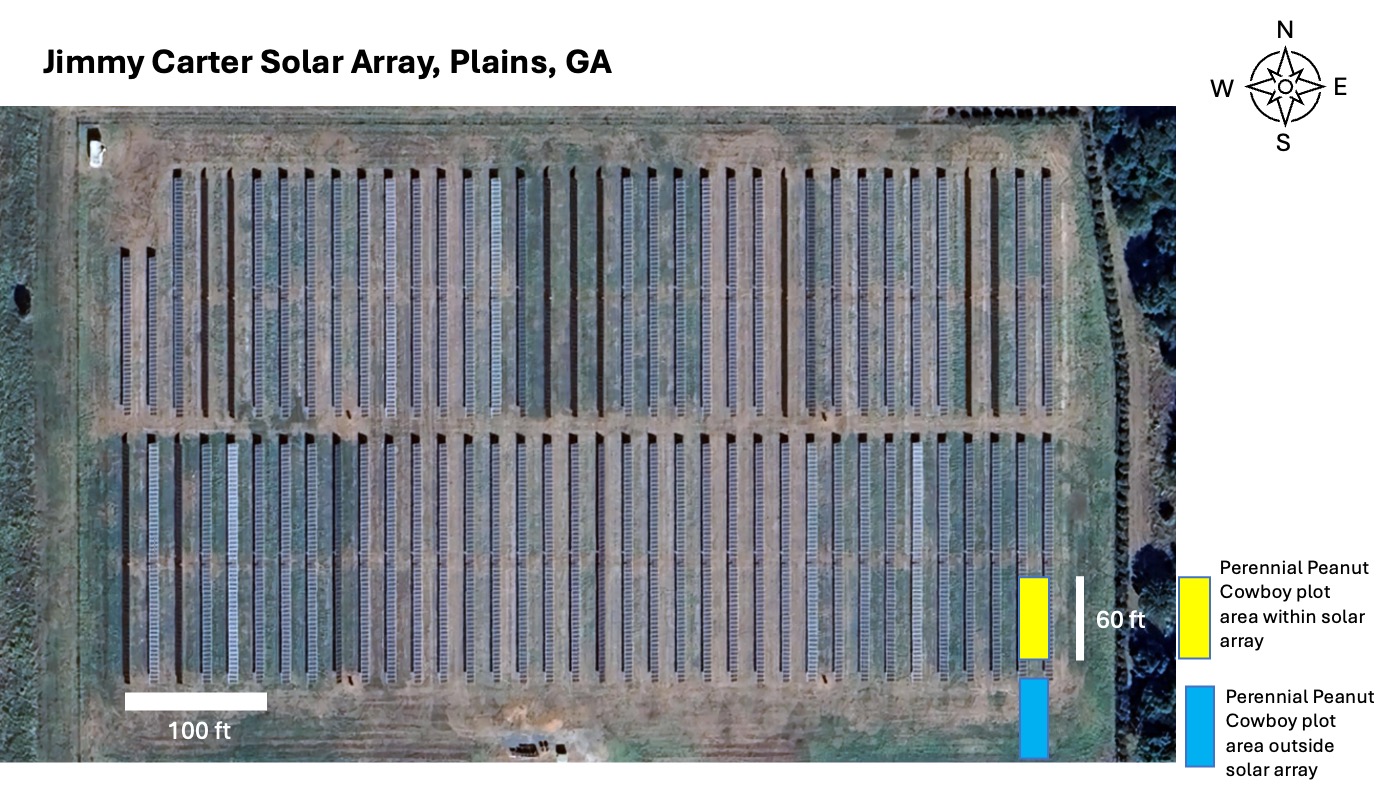
This project will build upon an existing research site at the seven-acre Jimmy Carter Solar Array, located in Plains, Georgia. In March 2025, RP ‘Cowboy’ was planted under and between solar arrays at the site’s southeast corner, as well as in an open-field similar-sized plot just past the two solar arrays (Fig. 1). Soil preparation prior to planting followed standard protocols.
Dormant rhizomes of RP ‘Cowboy’ (3 to 4 springs/foot) were strip-planted, and a chisel plow was used to break up the soil to create 4-inch-deep furrows. Irrigation was supplied with automatic sprinklers set to deliver one inch of rain per week. Weed control was performed twice throughout the growing season. By October 2025, RP had an excellent establishment.
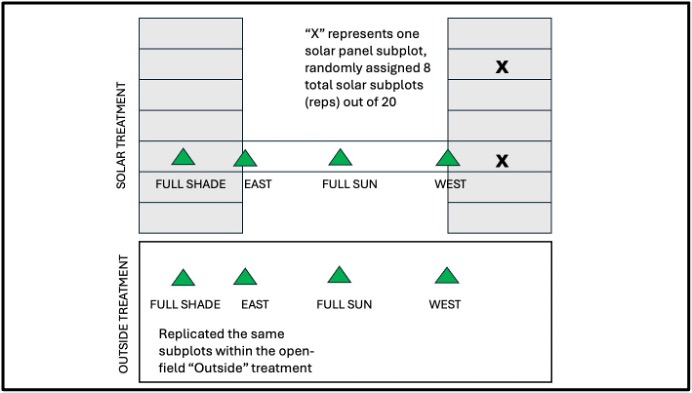
A total of six furrows or “strips” were spaced 18 inches apart underneath and between the solar panels, thus creating a microclimate gradient of part shade (two rows under the panel’s leading edge), full shade, and full sun.
The microclimate locations are: East, West, Full Sun, and Full Shade (Fig. 2); the first two represent the part-shade microclimate locations because they receive sunlight for only half of the normal daylight hours. The East strip is located beneath the solar panel’s eastern edge to receive light morning sunlight from the East for the first half of the day; as the solar panel tracks the sun, it places the strip in shadow for the second part of the day. The West strip is located at the solar panel’s western edge to receive afternoon sunlight from the West in the second half of the day. The full sun strip is located between the two solar panels so that it receives full sun throughout the day. The full shade strip is located underneath the solar panels so that it is almost fully shaded throughout the day. It should be noted that the full-shade strip does still receive some direct sunlight as the sun moves to the West later in the day and in winter when the angle of the sun is lower.
For the purposes of this study, we designated an area of two solar arrays, each with 26 individual solar panels, and each panel treated as a subplot. To evaluate solar panel impact on plant growth, eight of the 20 (edge panels excluded) solar panels across either one of the solar arrays were chosen at random; they represented 8 replicates. Of these, data is collected at each of the panel’s four microclimate locations (equating to treatments): East, Full Sun, West, and Full Shade (Fig. 2).
The RP strips extending outside the solar array (Fig. 1, blue rectangle) are designated as control (open field, no solar array). For the eight randomly selected sampling locations within the solar array, there are corresponding sampling locations in the open-field plot, to reflect an identical sampling area. Data from the East, West, Full Sun, and Full Shade strips were recorded at each of the eight locations. This control plot serves to answer the question of whether there is a difference between plants grown inside the solar array, and those grown in the open field.
At the time when measurements were carried out, subfreezing events occurred on November 10, 2025, and November 11, 2025, in Plains, Georgia, a week prior to data being taken, according to Georgia Weather Network.
Data Measurements
Data was taken at the Jimmy Carter Solar Array on November 17, 2025, at approximately 12:00 p.m. The average height and width (cm), cold damage, stomatal conductance (gsw), and quantum yield of fluorescence (ΦPSII) for each microclimate location (East, Full Shade, Full Sun, West) was recorded. Photosynthetic Photon Flux Density (PPFD) was measured using PPFD METER – Grow Light Meter app (v. 12.05 by Candas Pamukcu) to assess the amount of light for each microclimate location (Full Sun, East, West, Full Shade).
Morphological parameters. RP’s canopy height (cm) and width (cm) are measured from the soil to the topmost leaf, and width (spread) on both sides of the planting furrow, respectively. To calculate the percent damage caused by sub-freezing temperatures, a 9-section quadrat (50 x 50 cm) was placed over a plant strip in each sampling location. The vegetation in three of the nine diagonal quadrat sections was visually assessed to determine percent of RP foliage damage (dead leaves). The three quadrat section percentages provided an average percent cold damage per subplot. Lastly, the four microclimate locations’ percent of cold damage will be averaged across the 8 subplots to provide a replicate per treatment.
Physiological parameters. Stomatal conductance (gsw) and quantum yield of fluorescence (ΦPSII) were assessed with the LI-COR LI-600 Fluorometer/Porometer. For the 8 selected solar panel locations within the solar array, Cowboy’s stomatal conductance and chlorophyll fluorescence will be recorded across the four microclimate locations. Stomatal conductance is the measurement of the rate of water vapor diffusion through leaf stomata, measured in millimoles per meter squared per second. The stomatal conductance measurement indicates the degree of stomatal openness and density, providing insights into Cowboy’s gas exchange rate. Quantum yield of fluorescence (ΦPSII) measures the proportion of light absorbed by the protein pigment complex PSII in Cowboy’s chloroplasts. This fluorescence measurement provides insights into the leaf’s photosynthetic efficiency. Both of these physiological measurements help explain solar panel impact on Cowboy’s growth and performance.
Statistical Analysis
To determine the differences in height, width, average cold damage, stomatal conductance, and quantum yield of fluorescence, we fit generalized linear models using the the glmmTMB package (Brooks et al. 2017). Microclimate location (east, shade, sun, and west) was included as the only fixed effect in each model. The error distribution was gaussian with an identity link function for the height, width, and average cold damage models, beta with a logit link function for the stomatal conductance, and quantum yield of fluorescence models. Model assumptions were tested using simulated residuals from the DHARMa package (Hartig 2024). The quantum yield of fluorescence model showed evidence of heteroskedasticity, so a dispersion was modeled as a function of treatment, allowing for the variance to differ across treatment groups. To determine the significant differences among the levels of the microclimate locations, we used Tukey’s HSD post-hoc comparisons in emmeans (Lenth and Piaskowski 2025) and cld (Hothorn et al. 2008). To test differences in height, width, and average cold damage between plants grown inside the solar array and outside (across all microclimate locations), we used t-tests (assuming unequal variances for height and width, and equal variances for average cold damage as determined by visual assessment of residuals).
Results
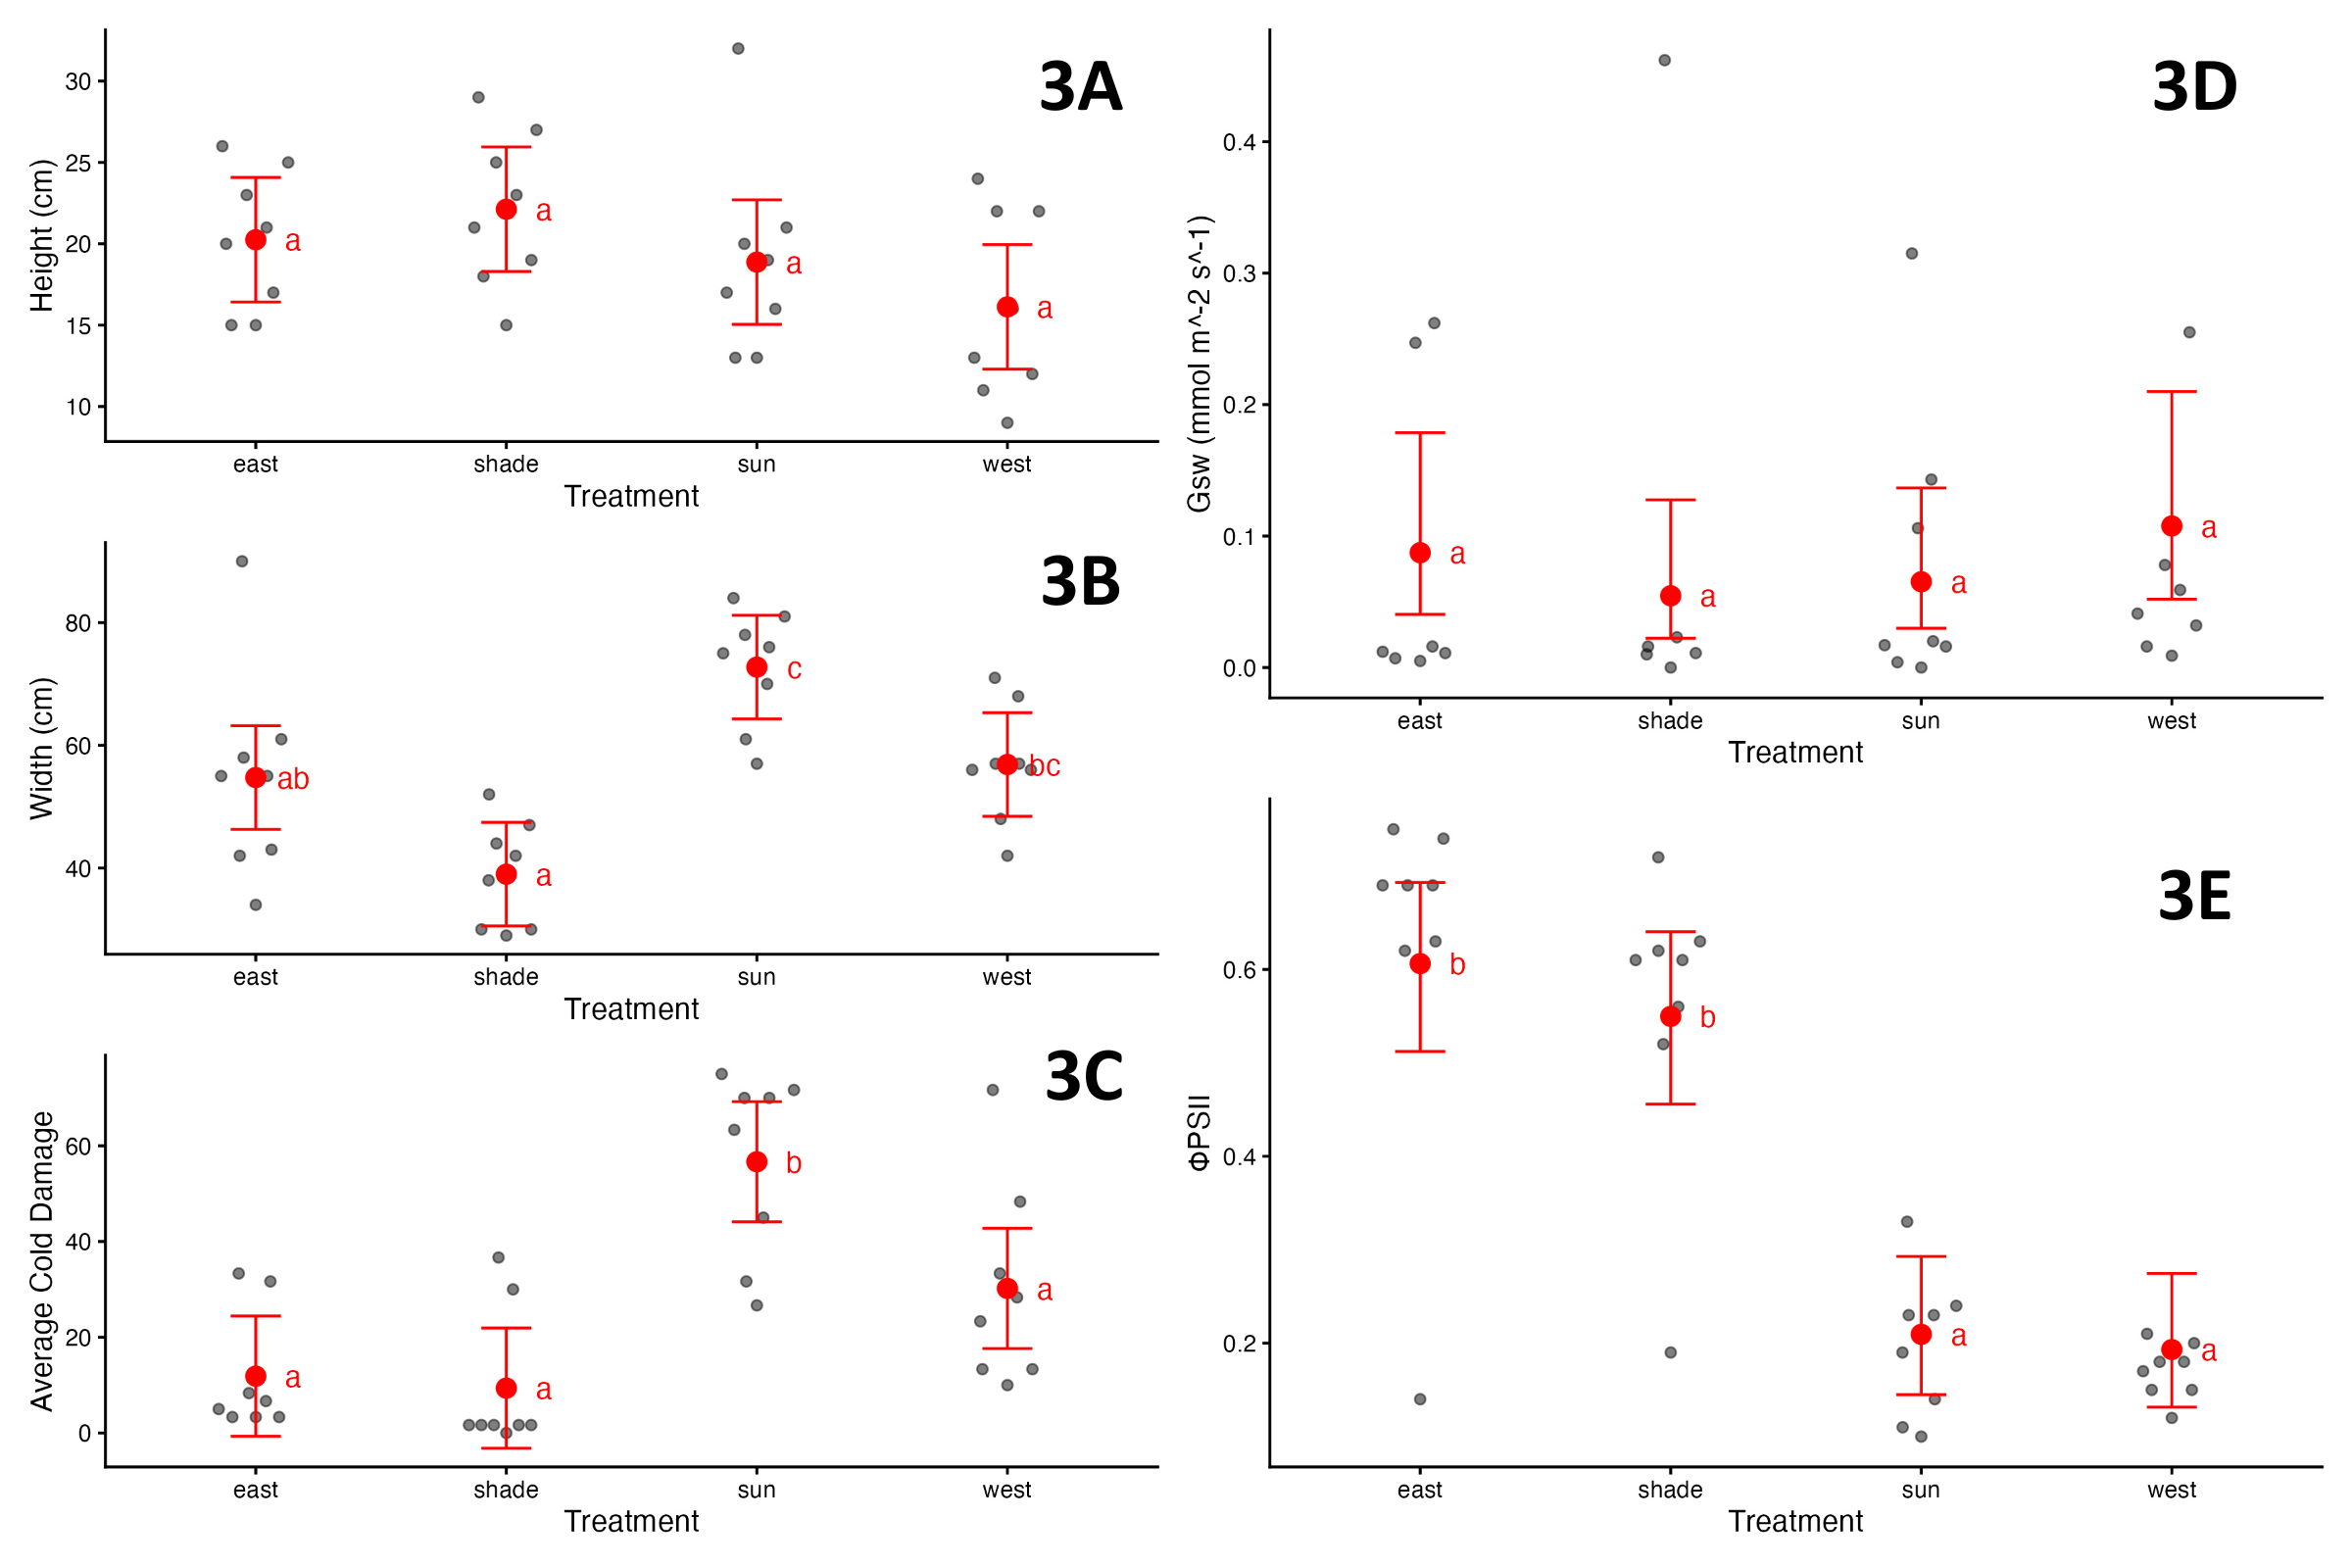
Morphological parameters. The average height of RP ‘Cowboy’ across microclimate treatments within the solar array were not statistically different from one another (𝜒23 = 6.26, p value = 0.099), but the average width of RP ‘Cowboy’ in Full Shade (39 cm) and Full Sun (72.75 cm) microclimate treatments were statistically different from one another (𝜒23 = 38.42, p value < 0.001) (Fig. 3, graphs 3A and 3B). Additionally, the average cold damage for RP ‘Cowboy’ in Full Sun (56.66%) was statistically different from all other microclimate treatments of Full Shade (9.38%), East (11.88%), and West (30.21%) (𝜒23 = 43.47, p value < 0.001) (Fig. 3, graph 3C).
Physiological parameters. The average stomatal conductance (gsw) of RP ‘Cowboy’ across microclimate treatments were not statistically different (𝜒23 = 2.20, p value = 0.532), but the average quantum yield of fluorescence (ΦPSII) for the East (0.62) and Full Shade (0.56) treatments were statistically different from the Full Sun (0.20) and West (0.17) microclimate treatments (𝜒23 = 104.54, p value < 0.001) (Fig. 3, graphs 3D and 3E).
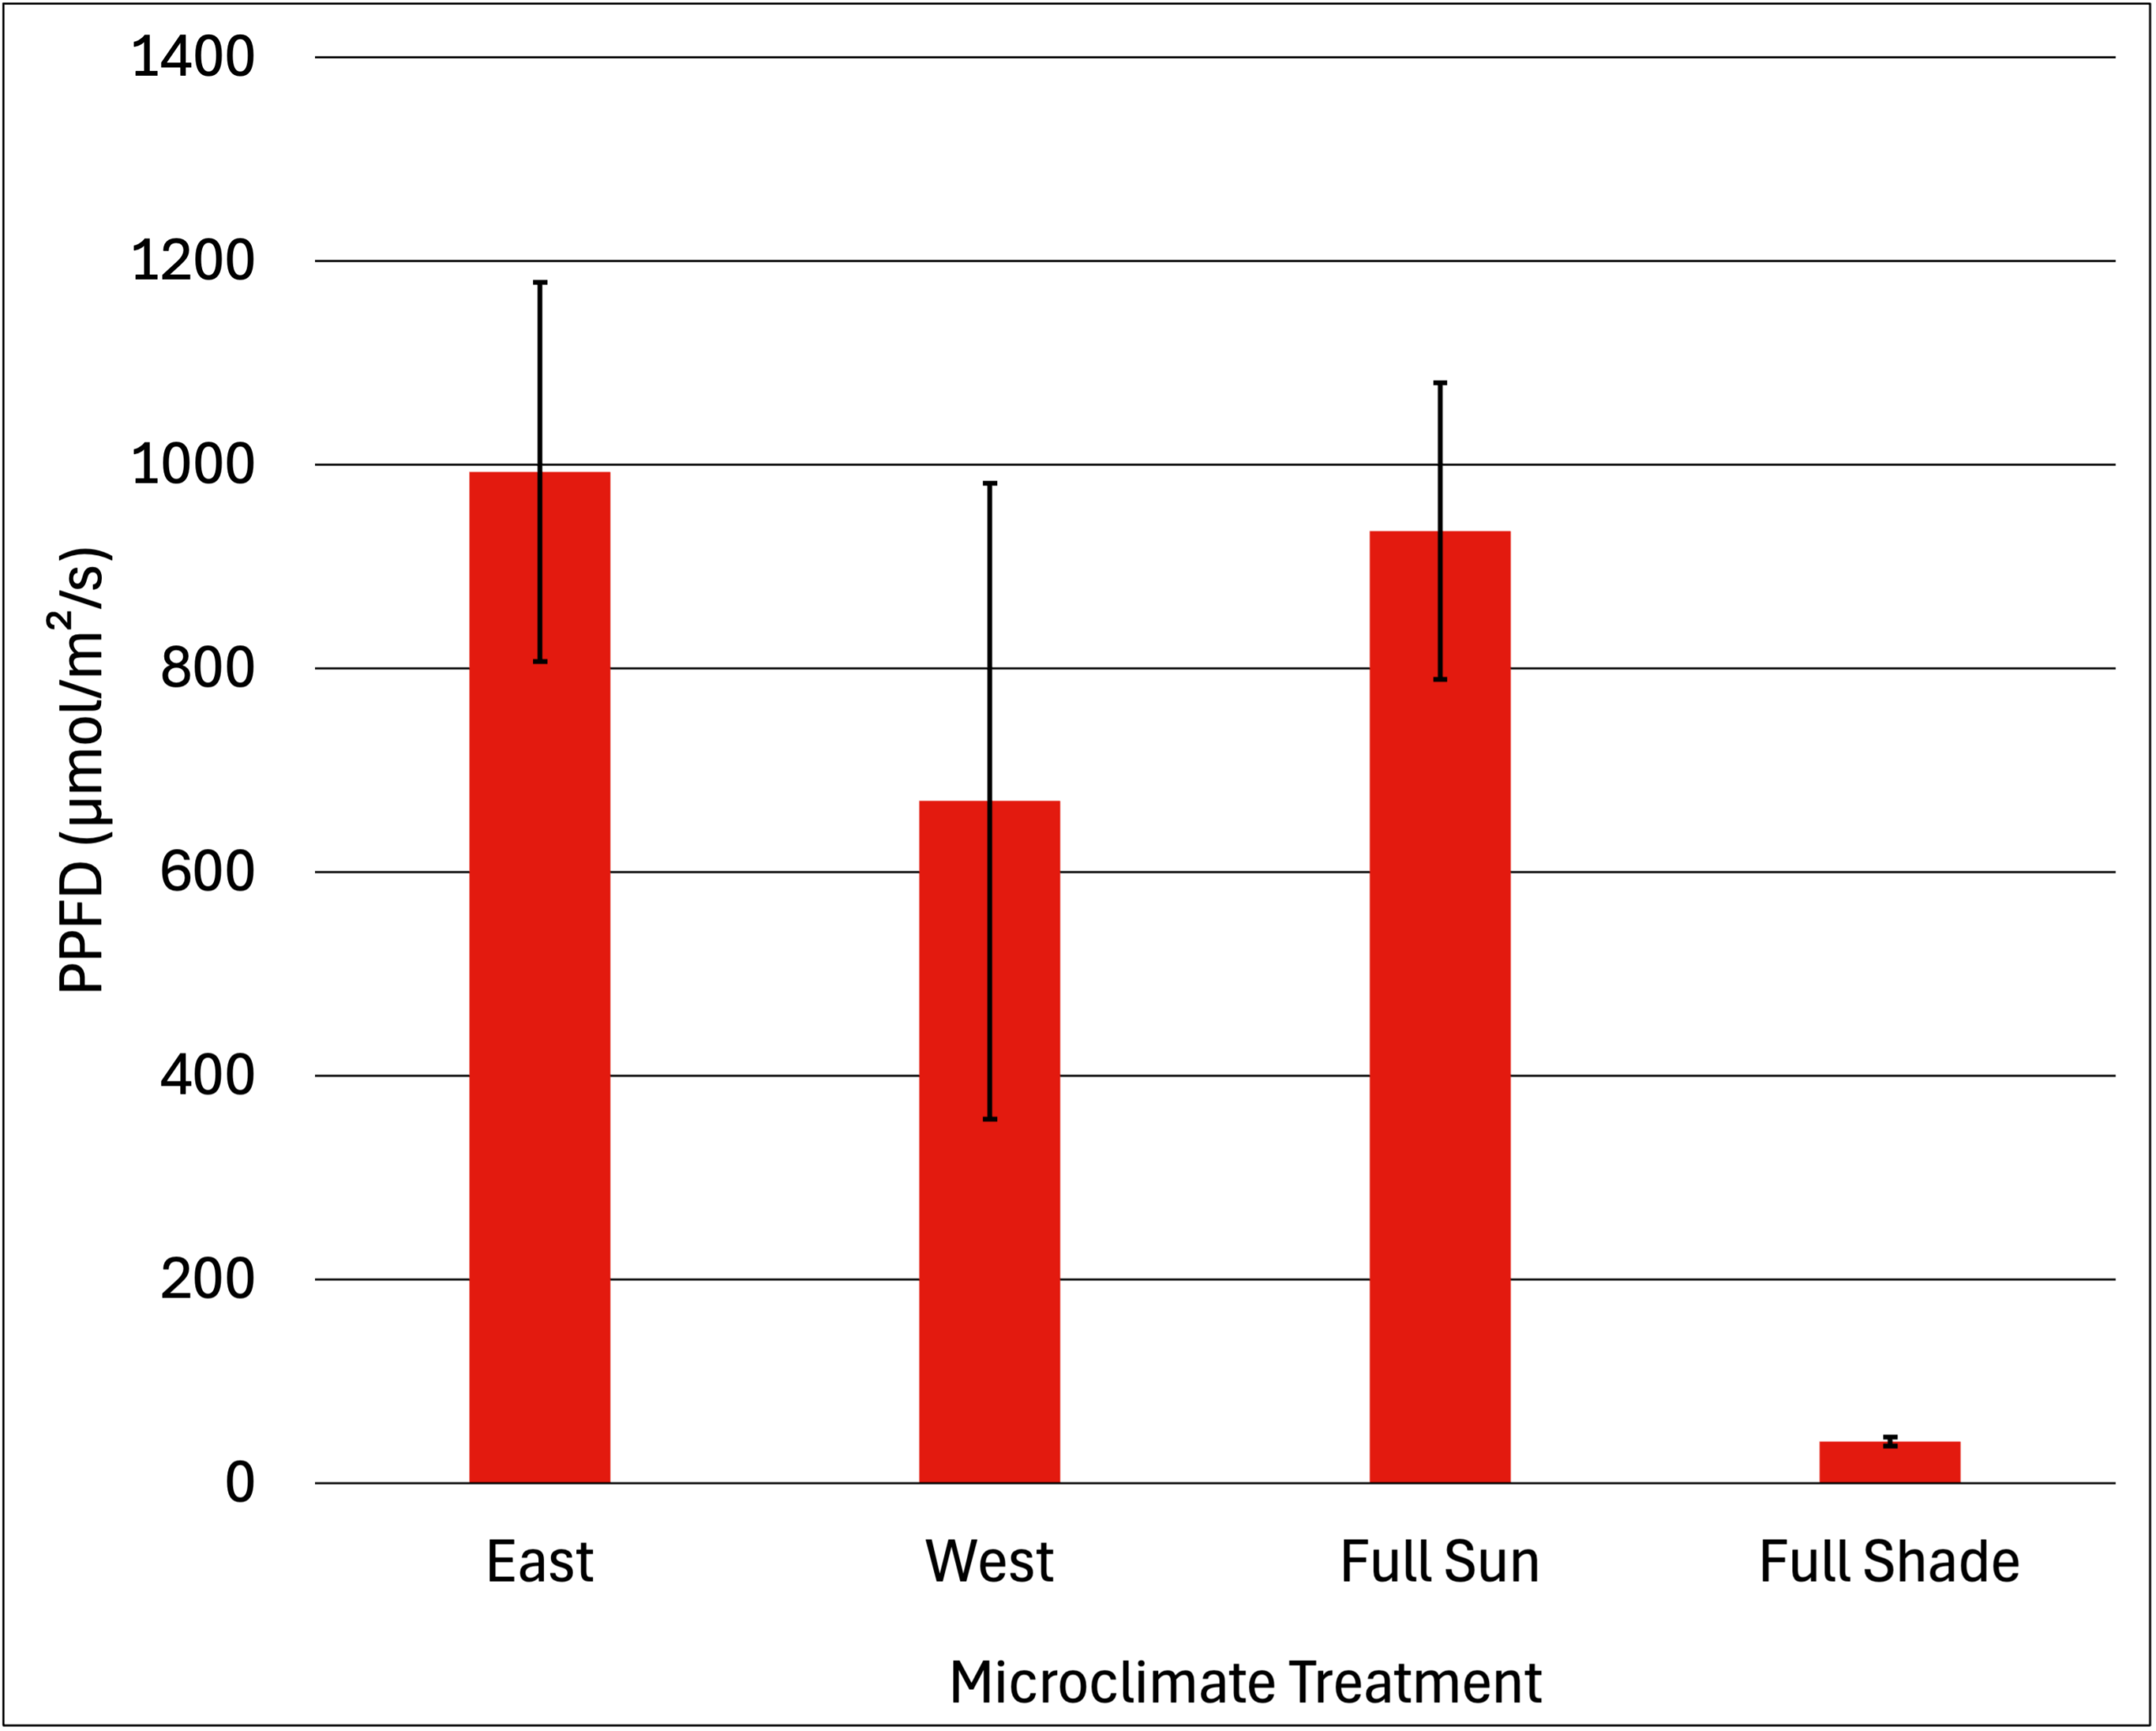
The average Photosynthetic Photon Flux Density (PPFD) for each microclimate treatment within the solar array is shown in Fig. 4.
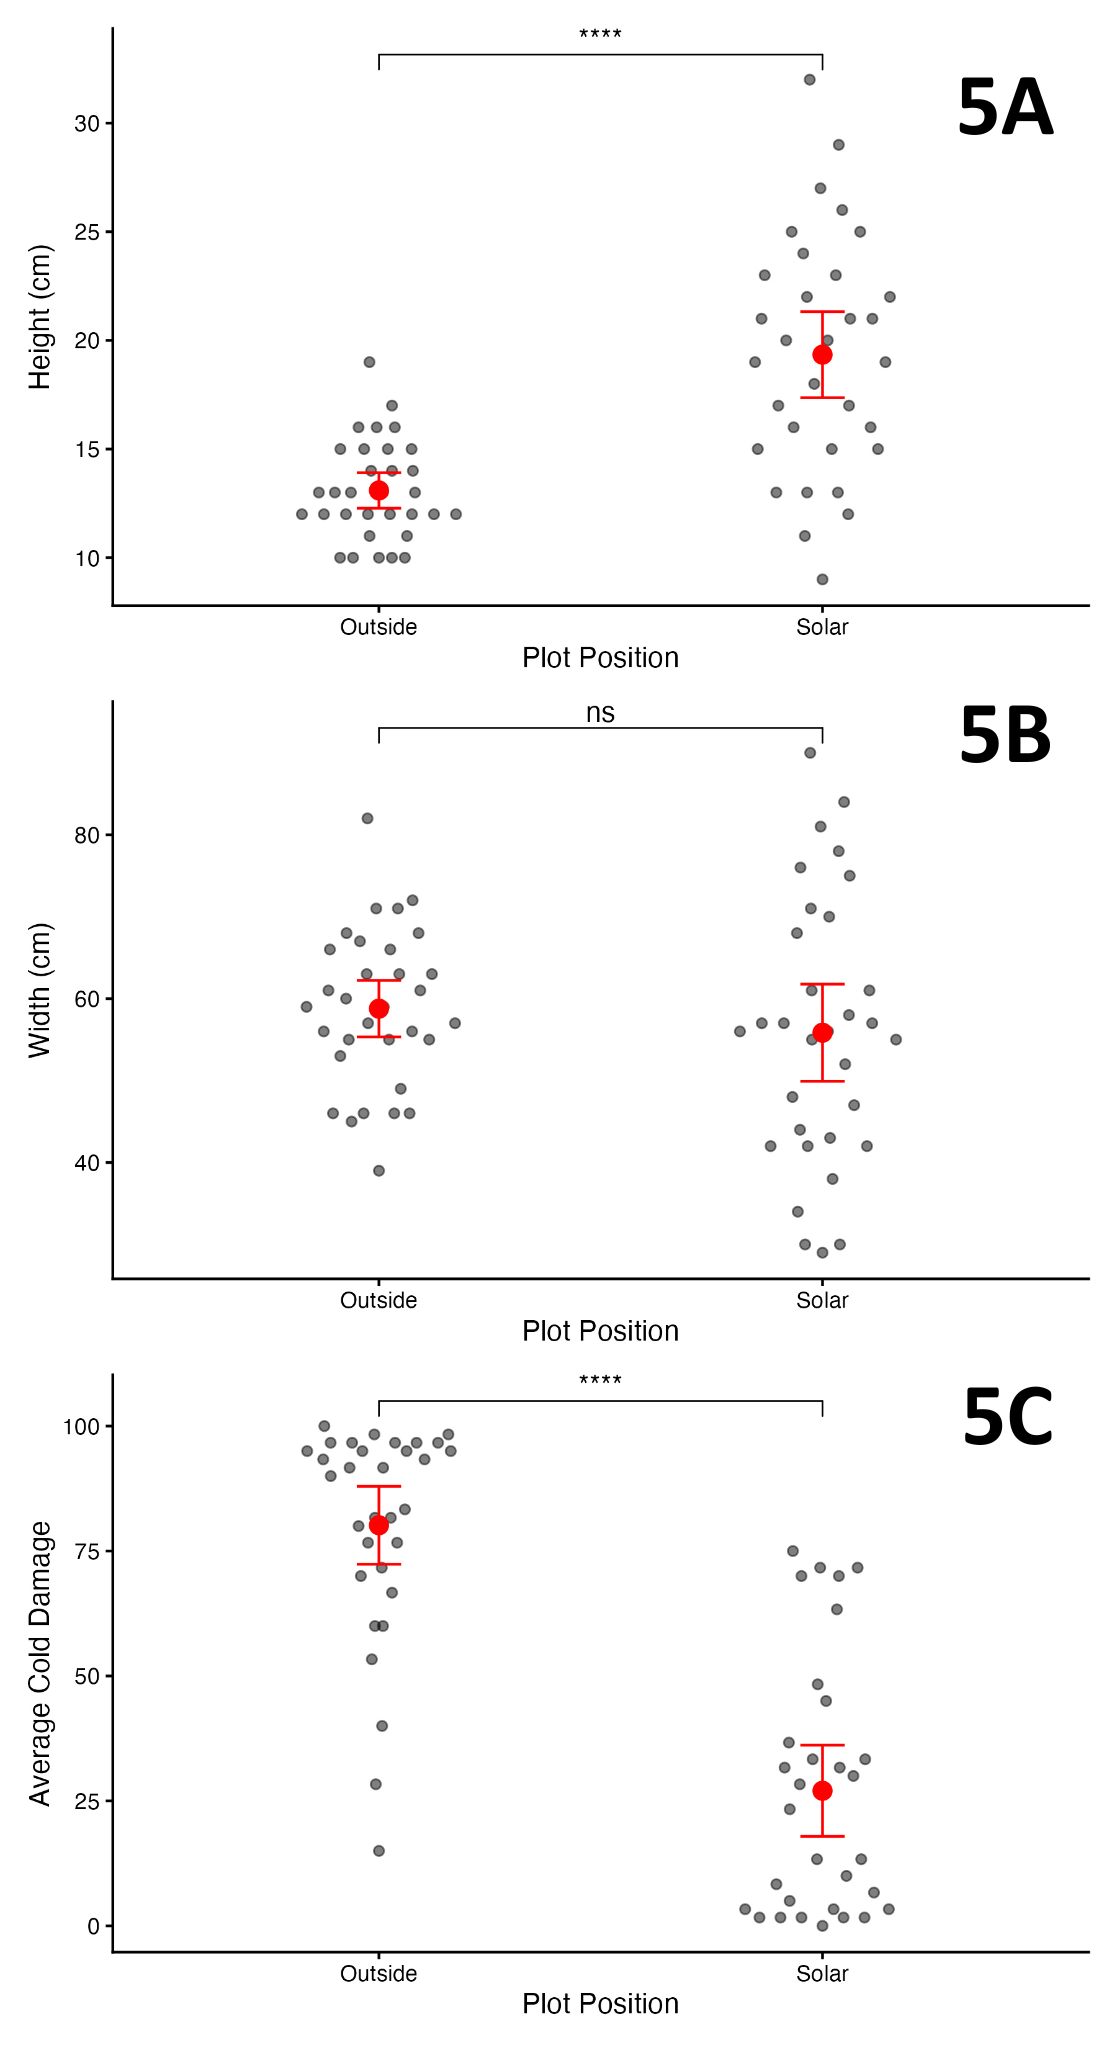
There was a statistically significant difference between the average height of RP ‘Cowboy’ across all four microclimate treatments within the solar array (19.34 cm) compared to the average height in the control open-field plot (13.10 cm) (t.test = 5.95, p value < 0.001) (Fig. 5, graph 5A). There was no statistically significant difference between Cowboy’s average width (cm) within and outside of the solar array (t.test = 0.87, p value = 0.387) (Fig. 5, graph 5B). Lastly, there was a statistically significant difference between the average cold damage for RP ‘Cowboy’ outside the solar array (80.16%) compared to average cold damage within the solar array (27.03%) (t.test = 9.03, p value < 0.001) (Fig. 5, graph 5C).
Discussion/ Conclusion
The initial questions this research project sought to answer were (1.) How does the microclimate variation within solar arrays impact RP’s growth? and (2.) Can solar panels mitigate or reduce plant stress induced by freezing temperatures? I hypothesized that microclimate variation will positively impact plant performance, with the part-shade treatments having the highest growth and the RP underneath panels having the lowest temperature-induced plant stress.
Solar microclimate variation did impact the growth of RP ‘Cowboy.’ There was a statistically significant difference in the level of cold damage and height (cm) between RP ‘Cowboy’ planted within a solar array compared to the “Outside” open-field plot. RP’s average height within the solar array was 6.25 cm taller than RP’s average height in the Outside treatment (Fig.5, graph 5A). Additionally, the Outside treatment (80.16% average cold damage) had a 196.56% higher level of cold temperature damage on Cowboy’s foliage than within the solar array (27.03% cold damage) (Fig. 5, graph 5C). Therefore, variation within solar arrays impacted RP’s growth, showing that the change in light and temperature induced by solar panels may favor growth and create a protection barrier against freezing temperatures.
The microclimate variation within the solar array showed that there was a statistically significant difference between RP’s width in the Full Shade and Full Sun treatments, with the highest average width (72.75 cm) in the full sun microclimate (Fig. 3, graph 3B). This correlates with the assumption that RP will spread the largest where it has the greatest light availability. The PPFD of the Full Sun treatment was 934.875 µmol/m²/s, almost as high as the East treatment with a PPFD of 993.125 µmol/m²/s (Fig. 4). The Full Sun and East microclimate locations having the highest PPFD correlates with the time of day (12:00 p.m.) and month (November) when data was taken. Interestingly, there was no statistically significant difference in height for RP across the four microclimate treatments (Fig 3, graph 3A).
There was a statistically significantly higher average cold damage for RP within the Full Sun microclimate treatment than any other microclimate location (Fig. 3, graph 3C). This meets the assumption that the solar panels provide a barrier in blocking colder temperatures, wind, and frost that might cause plant stress and damage to foliage, causing the most exposed RP within the solar array (the Full Sun treatment) to have the greatest amount of cold damage.
Although there was no statistically significant difference in average stomatal conductance (gsw) across the four microclimate locations (Fig. 3, graph 3D), there were significantly higher average quantum yield of fluorescence (ΦPSII) measurement for the East and Full Shade microclimate locations compared to Full Sun and West locations (Fig. 3, graph 3E). Quantum yield of fluorescence (ΦPSII) provides insight into RP’s photosynthetic efficiency, indicating that the lower averages for the Full Sun and West locations may be due to plant stress related to drought and cold temperature damage on RP’s foliage.
Although collected data did not indicate that there was one specific microclimate treatment with the greatest establishment or growth within the solar array, the statistically significant lower quantum yield of fluorescence (ΦPSII) and higher average cold damage of the Full Sun microclimate treatment points to higher stress of RP ‘Cowboy’ when in the Full Sun microclimate treatment. RP’s lower average height and higher cold damage within the Outside control plot also supports this assertion, showcasing how RP’s establishment may be favored within a solar setting. These findings support the initial hypothesis that solar panel microclimate variation will impact plant performance and provide protection against plant stress induced by cold temperatures.
Plant performance will be assessed again (growth, percent cold damage, stomatal conductance, and chlorophyll fluorescence) in 2026 to record plant survival and recovery. As NOAA models forecast warmer and drier upcoming seasons for the Southeast, this may translate to higher plant survival, and long-term success of RP.
In conclusion, RP’s establishment within a solar setting north of its typical range showcases Cowboy’s potential for use within agrivoltaic settings in Georgia. Further research analyzing RP’s behavior will be conducted across growing seasons to better understand how ‘Cowboy’ establishes within a solar setting a year from being planted. On a large scale, this project evaluates whether the microclimate variation induced by solar panels fosters favorable conditions for plant biodiversity, thus contributing to the ecological functionality and resilience of the agrivoltaic system. With the solar industry’s growth in Georgia, these findings provide considerations for the state’s commercial solar installation groundcover and potential agrivoltaic livestock forage.
References
Anderson, B., Knox, G. W., Blount, A. R., Mackowiak, C. L., & Gilman, E. F. (2015). Ornamental Groundcover Characteristics of Rhizoma Peanut (Arachis glabrata Benth.): Shade Affects Height but not Cover. HortScience, 50(7), 952–956. https://doi.org/10.21273/hortsci.50.7.952
Ardani, K., Denholm, P., Mai, T., Margolis, R., O’Shaughnessy, E., Silverman, T., & Zuboy, J. (2021). U.S. Department of Energy. Solar Futures Study. https://www.energy.gov/sites/default/files/2021-09/Solar%20Futures%20Study.pdf
Baltensperger, D. D., Prine, G. M., & Dunn, R. A. (1986). Root-knot Nematode Resistance in Arachis Glabrata. Peanut Science, 13(2), 78–80. https://doi.org/10.3146/i0095-3679-13-2-9
Barron-Gafford, G. A., Pavao-Zuckerman, M. A., Minor, R. L., Sutter, L. F., Barnett-Moreno, I., Blackett, D. T., Thompson, M., Dimond, K., Gerlak, A. K., Nabhan, G. P., & Macknick, J. E. (2019). Agrivoltaics provide mutual benefits across the food–energy–water nexus in drylands. Nature Sustainability, 2(9), 848–855. https://doi.org/10.1038/s41893-019-0364-5
Brooks, M. E., Kristensen, K., van Benthem, K. J., Magnusson, A., Berg, C. W., Nielsen, A., Skaug, H. J., Maechler, M., Bolker, B. M. (2017). glmmTMB balances speed and flexibility among packages for zero-inflated generalized linear mixed modeling. The R Journal, 9(2), 378-400. https://doi.org/10.32614/RJ-2017-066.
Carl Vinson Institute of Government. (2025). Utility-Scale Solar Land Use in Georgia. In FLIPHTML5. https://fliphtml5.com/grxxo/ifaj/Utility-Scale_Solar_Land_Use_in_Georgia_%7C_2025_Status_Update/
GA DNR. (2024). Recommended Practices for the Responsible Siting and Design of Solar Development in Georgia. https://georgiawildlife.com/sites/default/files/wrd/pdf/WCS/GA%20Recommended%20Practices%20for%20Solar-%20May%202024%20-%20V2.0.pdf
Hartig, F. (2024). DHARMa: residual diagnostics for hierarchical (multi-level/ mixed) regression models. https://doi.org/10.32614/CRAN.package.DHARMa.
Hothorn, T., Bretz F., Westfall, P. (2008). Simultaneous inference in general parametric models. Biometrical Journal, 50(3), 346-363.
Jaramillo, D. M., Dubeux, J. C. B., Mackowiak, C., Sollenberger, L. E., Santos, E. R. S., Garcia, L., Ruiz‐Moreno, M., Silva, C. S., & DiLorenzo, N. (2018). Annual and Perennial Peanut Species as Alternatives to Nitrogen Fertilizer in Bermudagrass Hay Production Systems. Agronomy Journal, 110(6), 2390–2399. https://doi.org/10.2134/agronj2018.01.0036
Lange, M., Habekost, M., Eisenhauer, N., Roscher, C., Bessler, H., Engels, C., Oelmann, Y., Scheu, S., Wilcke, W., Schulze, E.-D., & Gleixner, G. (2014). Biotic and Abiotic Properties Mediating Plant Diversity Effects on Soil Microbial Communities in an Experimental Grassland. PLOS One, 9(5), e96182. https://doi.org/10.1371/journal.pone.0096182
Lenth, R., Piaskowski, J. (2025). emmeans: estimated marginal means, aka least-squares means. https://rvlenth.github.io/emmeans/
Macknick, J., Hartmann, H., Barron-Gafford, G., Beatty, B., Burton, R., Seok-Choi, C., Davis, M., Davis, R., Figueroa, J., Garrett, A., Hain, L., Herbert, S., Janski, J., Kinzer, A., Knapp, A., Lehan, M., Losey, J., Marley, J., MacDonald, J., McCall, J., Nebert, L., Ravi, S., Schmidt, J., Staie, B., Walston, L. (2022). The 5 Cs of Agrivoltaic Success Factors in the United States: Lessons from the InSPIRE Research Study (No. NREL/TP-6A20-83566, 1882930, MainId:84339; p. NREL/TP-6A20-83566, 1882930, MainId:84339). https://doi.org/10.2172/1882930
Maerz, John C, and Hepinstall-Cymerman, Jeffrey. 2025. Estimation of Land Use Conversion to Solar in Georgia Between 2000 and 2024. Warnell School of Forestry and Natural Resources, University of Georgia. https://fliphtml5.com/grxxo/ifaj/Utility-Scale_Solar_Land_Use_in_Georgia_%7C_2025_Status_Update/
Mier-Valderrama, L., Leal, J., Perotto-Baldivieso, H. L., Hedquist, B., Menendez, H. M., Anoruo, A., & Turner, B. L. (2023). Evaluating soil erosion and runoff dynamics in a humid subtropic, low stream order, southern plains watershed from cultivation and solar farm development. International Soil and Water Conservation Research, 12(2), 432–445. https://doi.org/10.1016/j.iswcr.2023.09.004
Moon, H.-W., & Ku, K.-M. (2023). The effect of additional shading utilizing agriphotovoltaic structures on the visual qualities and metabolites of broccoli. Frontiers in Plant Science, 14, 1111069. https://doi.org/10.3389/fpls.2023.1111069
Mullenix, M. K., Sollenberger, L. E., Blount, A. R., Vendramini, J. M. B., Silveira, M. L., & Castillo, M. S. (2014). Growth Habit of Rhizoma Peanut Affects Establishment and Spread when Strip Planted in Bahiagrass Pastures. Crop Science, 54(6), 2886–2892. https://doi.org/10.2135/cropsci2014.03.0254
Pennisi, S., Schmidt, J., Giovengo, K., & Shereen, X. 2021. Solar Farms as Biodiversity Hotspots. HortScience 56(9), S165
Pitardi, S., Pennisi, S., Leyton Naranjo L., & Schmidt, J. M. 2025. Assessment of Rhizoma Perennial Peanut under Agrivoltaic System in Georgia. HortScience 60(9) S7
Owens, L. B., & Bonta, J. V. (2004). Reduction of Nitrate Leaching with Haying or Grazing and Omission of Nitrogen Fertilizer. Journal of Environmental Quality, 33(4), 1230–1237. https://doi.org/10.2134/jeq2004.1230
Quesenberry, K. H., Blount, A. R., Mislevy, P., French, E. C., Williams, M. J., & Prine, G. M. (2010). Registration of “UF Tito” and “UF Peace” Rhizoma Peanut Cultivars with High Dry Matter Yields, Persistence, and Disease Tolerance. Journal of Plant Registrations, 4(1), 17–21. https://doi.org/10.3198/jpr2009.07.0397crc
R Core Team (2025). R: A Language and Environment for Statistical Computing. R Foundation for Statistical Computing, Vienna, Austria. https://www.R-project.org/.
Santos, E., Dubeux, J., Sollenberger, L. E., Mackowiak, C., Jaramillo, D. M., van Cleef, F., Queiroz, L., Garcia, L., Siqueira, M., Zagato, L., Vela‐Garcia, C. C., Longhini, V. Z., & Homem, B. (2025). Rhizoma peanut root‐rhizome mass, growth, and decomposition under grazing or clipping management. Crop Science, 65(3). https://doi.org/10.1002/csc2.70069
Schnur, S., Maki, C., & Burchfield, E. (2024). “Farmers need the Land”: Georgia’s agricultural future in the patchy Anthropocene. Journal of Rural Studies, 107, 103259. https://doi.org/10.1016/j.jrurstud.2024.103259
Shaw, J., Echols, T., Johnson, F., McDonald, L., & Pridemore, T. (2024). Georgia Public Service Commision 146th Annual Report 2024.
Silicon Ranch. (2023). Houston Solar Project – Silicon Ranch. Silicon Ranch. https://www.siliconranch.com/us-solar/ga/houston-solar-project/
Stock, R., & Birkenholtz, T. (2019). The sun and the scythe: energy dispossessions and the agrarian question of labor in solar parks. The Journal of Peasant Studies, 48(5), 984–1007. https://doi.org/10.1080/03066150.2019.1683002
Terrill, T. H., Gelaye, S., Mahotiere, S., Amoah, E. A., Miller, S., Gates, R. N., & Windham, W. R. (1996). Rhizoma Peanut and Alfalfa Productivity and Nutrient Composition in Central Georgia. Agronomy Journal, 88(3), 485–488. https://doi.org/10.2134/agronj1996.00021962008800030021x
Thompson, C. (2017, June). UGA-bred “Cowboy” perennial plant offers color, nitrogen to homeowner’s lawn | CAES Field Report. University of Georgia College of Agricultural and Environmental Sciences Field Report; University of Georgia. https://fieldreport.caes.uga.edu/news/uga-bred-cowboy-perennial-plant-offers-color-nitrogen-to-homeowners-lawn/
Ugiansky, R. J. (2020). Bermudagrass For Heavy Use Areas and Pastures. United States Department of Agriculture. https://www.nrcs.usda.gov/plantmaterials/mdpmcsr13606.pdf.
United States Environmental Protection Agency. (2025, July 29). Summary of Inflation Reduction Act provisions related to renewable energy. United States Environmental Protection Agency. https://www.epa.gov/green-power-markets/summary-inflation-reduction-act-provisions-related-renewable-energy
Williams, M. J. (1994). Growth Characteristics of Rhizoma Peanut and Nitrogen‐Fertilized Bahiagrass Swards. Agronomy Journal, 86(5), 819–823. https://doi.org/10.2134/agronj1994.00021962008600050013x
Williams, M. J., Hammond, A. C., Kunkle, W. E., & Spreen, T. H. (1991). Stocker Performance on Continuously Grazed Mixed Grass-Rhizoma Peanut and Bahiagrass Pastures. Journal of Production Agriculture, 4(1), 19–24. https://doi.org/10.2134/jpa1991.0019
Zheng, J., Luo, Y., Chang, R., & Gao, X. (2023). An observational study on the microclimate and soil thermal regimes under solar photovoltaic arrays. Solar Energy, 266, 112159–112159. https://doi.org/10.1016/j.solener.2023.112159
Zhou, Y., Zhu, H., Fu, S., & Yao, Q. (2017). Variation in Soil Microbial Community Structure Associated with Different Legume Species Is Greater than that Associated with Different Grass Species. Frontiers in Microbiology, 8(1007). https://doi.org/10.3389/fmicb.2017.01007
Acknowledgements: A special thank you to Dr. Bodie Pennisi and Dr. Mark Hunter for their guidance and mentorship throughout this research process, Dr. Connor Fair for his assistance in the project’s statistical analysis, the Vertically Integrated Projects for Research for funding this research, and the Center for Undergraduate Research Opportunities.
Citation Style: APA 7th Edition